The Google Sheets Dashboard is a tool that enables you to create a visual representation of data within a Google Sheets spreadsheet. With a wide range of customization options, chart types, and collaboration features, it helps you to create an effective representation of your data, allowing users to quickly understand and analyze large amounts of information. The dashboard transforms complex data into an easy-to-comprehend format.
Dashboard is customized to meet specific needs, and shared with others for collaboration. Whether you’re working on a individual project or a team project, Google Sheets Dashboard is a must-have tool for anyone who is employed in small business.
Benefits of Dashboards:
- Display centralized data summaries.
- Track the performance of employees or individuals.
- Identify the performance of products and services.
- Show trends in sales or attendance.
- Display the overall performance of a company.
- Track the progress of courses and projects.
Offer improved sharing options with more impactful presentations. Creating a dashboard in Google Sheets is a great way to visualize and organize your data. Listed below are simple steps, to create a customized dashboard that makes it easy to access and understand your data.
1 . Open Google Sheets file:

To create a Google Sheets dashboard, start by opening a Google Sheets file. If you already have a file that contains the data you want to display in your dashboard, you can use that file.
If you do not have one, create a new file and enter your data by following the steps,
Step 1: Go to the Google Drive homepage
Step 2: Log in with your Google account
Step 3: Click the “New” button in the top-left corner and select “Google Sheets”
Step 4: Choose to create a new blank sheet or select a template
Step 5: Your new Google Sheets file is now open and ready for use
2 . Create charts and graphs:
Once you have your data in place, you can create charts and graphs to visualize it. Google Sheets offers a wide range of chart and graph options, including bar charts, line charts, pie charts, and more, to help you create meaningful visual representations of your data and uncover trends, patterns, and insights.

To create charts and graphs from data in Google Sheets,
Step 1: Select the data range you want to use for the chart/graph
Step 2: Go to Insert menu and select the type of chart/graph you want to create
Step 3: Insert the created chart/graph in the sheet
Step 4: Customize the chart/graph using options in the right-side panel

3 . Arrange into a separate sheet to form the dashboard:
The next step in creating your dashboard is to arrange your charts and graphs on a separate sheet. To do this, select the charts and graphs you want to include, copy them, and paste them onto a new sheet. Then, rearrange the charts and graphs on the sheet as needed by dragging and dropping to create an organized and easy-to-read dashboard.

4 . Use layout and formatting options to make it visually appealing:
Once you have arranged your charts and graphs in the sheet, use layout and formatting options by adding background colors, borders, font styles and other design elements to create a cohesive and professional-looking dashboard.

5 . Add filters:
Finally, add filters to your dashboard to make it more interactive and allow you to easily view specific data points. Using filters, you can control which data points should be displayed on your dashboard, making it easier to focus on the information that is most relevant to you.
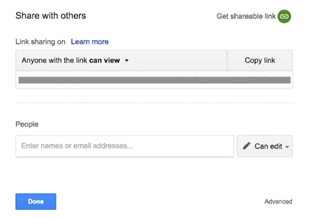
6 . Make a dashboard in Google Sheets visible to others:
Finally, you can share your dashboard with colleagues, clients or anyone. To do this, click the Share button in the top right corner of the screen, which opens the sharing options. From here, enter the email addresses of the people you want to share with directly.
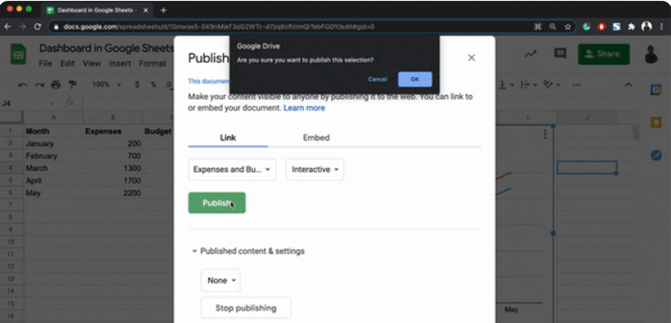
“Finally, you can publish your Google Sheets dashboard as a web page or embed it into another page for wider visibility and easy access for your audience.
Google Sheets Dashboards can be used in various specialized applications, including business intelligence, project management, marketing analytics, sales analysis, inventory management, and health monitoring.
Overall, the Google Sheets dashboard enhances data visualization, streamlines data management, facilitates informed decision-making, facilitates collaboration, offers extensive customization options, and provides actionable insights. The dashboards can be customized and arranged to meet specific needs, shared and edited by multiple users, and are interactive, allowing users to delve into data and view it in greater detail. Google Sheets dashboards offer a powerful tool that helps users to make informed decisions.
Share this blog :